Large investor-owned utilities (IOUs) have been the vehicle of choice for the state to implement its wide ranging energy policies. In particular, the California Public Utilities Commission has implemented state renewable energy policy by requiring a series of competitive solicitations conducted by the IOUs. In total this has been a success in increasing renewable generation and in reducing its cost.
But now, major head winds are affecting the state’s policy options:
- The state has authorized Community Choice Aggregators (CCAs) which have been peeling off IOU bundled load leaving less utility load to absorb state mandated purchases. For instance, PG&E now estimates that Direct Access and CCAs will serve 55% of its load in 2020. With that amount of load departing, PG&E states they have sufficient renewable resources to meet all their current state-mandated requirements. The impacts of this huge structural change in the electric market are now just starting to unfold.
- PG&E’s bankruptcy has many indirect impacts. Owners of the 298 contracts/projects selling to PG&E as part of the State’s RPS program are now faced with assertions that many of these contracts are at “above market rates”. While the utility hasn’t concluded or recommended to the bankruptcy court that some of these contracts be invalidated, this is a serious concern for generators and state policy-makers.
This combination of major market restructuring, and the risk that contacts might be invalidated, is dramatically changing the dynamics for the state. While for generators it’s business as usual, expect for generator produced pre-bankruptcy and not yet paid for, these uncertainties are chilling.
Posted by admin on March 1, 2019 at 2:07 pm under Uncategorized.
Comments Off on Chaos in California energy markets.
Effective 9/1/2013 I’ve stopped computing indices for these sectors. I’ve concluded that the clean energy sector isn’t a separate asset class and as a result it doesn’t fit into my investment framework. That said, for those interested in investing in this sector there a plenty of ETFs available for sector specific investment in solar and wind (sort of) and broader based collections of “clean energy” companies. You can find all of these under the Equities menu at www.newenergyview.com
Mark
Posted by admin on September 20, 2013 at 12:07 pm under Indices.
Comments Off on Creation of Solar, Renewable Electricity, LED, and Biofuel indices terminated.
CNN Republican debated, 10/18/2011
“We’ve all taken some big hits, but this is America. With more energy from coal, the fuel that supplies over 1/2 of our energy affordably, we’ll keep energy costs in check, jobs in America, and together we will power the next great comeback!” – American Coalition for Clean Coal Electricity.
Now, in December of 2012, you would think they were talking about shale gas.
Environmental activist Robert F. Kennedy Jr. one liners at “greenwise Sacramento”, 11/19/2010 aimed at the anti-clean energy forces:
- trogledytes on Capital Hill
- sock puppets of polluters
- toadies on Fox Radio
- treating the planet like a liquidation
- phony think tanks on Capital Hill
- monopolistic kleptocracy
- biostitues who will say anything
- carbon cronies
- dirty fuels from hell !
- green clean energy from heaven !
I was on my feet, pumping my fist and looking for a demonstration. Very entertaining if nothing else.
Posted by admin on December 23, 2012 at 11:17 am under News.
Comments Off on Two sides of clean energy politics ;-).
Renewable resources have been promoted in California since the early 1980s. After the passage of PURPA and the advent of Qualifying Facilities, an number of hydro, wind, geothermal, and biomass projects were constructed in California. Today, most of these projects have reached or are nearing the end of their original contracts. And in many cases the only contract option available to these projects is a “QF legacy contact”. Pay close attention, the bulk of the price paid under these legacy contracts is determine either directly by gas prices via a heatrate, or indirectly via the western US power market with is dominated by combined cycle generation. Draw your own conclusions from the graph below on whether California is encouraging legacy renewables:

Posted by admin on December 8, 2012 at 11:37 pm under Analysis.
Comments Off on Shale gas negatively affecting renewable resources in California.
I’ve been busy so I haven’t updated the underlying company data since 5/28. So when I ran a few queries today to perform an update I found a large number of OTC companies were now valued under $1 million USD and had sunk into un-traded status. With the blush off the sustainable energy business I don’t think many, if any, of these small OTC companies will develop. As a result I’ve pruned my database of these firms and I’m now tracking 303 companies. So after years of development, the sustainable energy business, in the aggregate, represents 27% of the market value of Exxon Mobil.
Why do I say the blush is off the sustainable energy business? Here are a couple of quick reasons:
- shale gas in the US is providing a clean, low cost energy supply that is directly competing with renewable electric generation. One location where I generate electricity had the “Short run avoided cost” electric price for May set at less than $20/MWh! This super low prices stems from cheap gas, tons of efficient combined cycle generation in the western US, and locational marginal pricing penalizing a rural location. Try to generate anything, much less solar or wind, at that price level.
- budget problems everywhere are affecting subsidies and subsidies are what have gotten the sustainable energy business rolling, and
- the growing realization that no progress is being made, or frankly is likely to be made, on green house gas emission reductions is leading to diminished support for the subsidies supporting higher cost low-carbon sources. The subsidies aren’t just high tariff rates but also RPS programs and cap-and-trade programs monetizing RECs.
That said, there has been a lot of progress made, particularly in the electric generation arena. Wind and solar are now more efficient and lower cost then ever before. And of all the renewables they have proven to be scale-able to a meaningful size. It also possible that EVs will able to improve their competitive position against gasoline / diesel internal combustion engines. EVs work, it just a matter of cost. And sustainable energy has real value as a hedge against the inevitable price excursions in the fossil markets.
Posted by Mark Henwood on July 6, 2012 at 7:02 pm under Indices.
Comments Off on OTC listed sustainable energy companies are fading.
Yesterday the 10 year TIPS closed at an all time low of -0.33%. The flight to safety due to the Greek crisis pushes TIPS down because 10 year exceptions of inflation are not really being affected by Greece. ( TIPS + inflation expectation = Nominal treasury yield ). Fixed income investors are going to have to tolerate an “extended period” of low returns. If you want to see this data in a nice convenient form look under the fixed income > historic yields tab and select TIPS.
Posted by Mark Henwood on May 15, 2012 at 12:19 pm under Market commentary.
Comments Off on TIPS continue to plumb new lows.
The records keep falling … the oil/gas price ratio hit another all time high on the 19th at 9.29 (Cushing closed at $102.58/bbl and Henry gas closed at $1.90/mmBtu). The gas price is the equivalent of oil at $11.02/bbl.
Meanwhile, low gas prices are driving the price paid to older renewable producer in California to near record low levels. In PG&E the April price for “Short Run Avoided Cost” is 2.7 cents/kWh. IMO prices this low will cause some renewable facilities to shut in, unable to recover operating costs, much less insurance or property taxes. It’s ironic for a state that is imposing a 33% RPS standard and implementing a cap and trade system to have a pricing mechanism that will force some production to, effectively, be flared.
Posted by Mark Henwood on April 20, 2012 at 10:59 am under Market commentary.
Comments Off on Shale gas flaps its black wings.
For the first time the price of crude at Cushing Oklahoma is over 8 times (on an energy basis) the price of natural gas at Henry Louisiana. And Cushing is below world markets as measured by Brent. Small wonder that automakers are starting to produce duel fueled gasoline / natural gas vehicles. With this wide a price differential it should be possible to get natural gas to the tank for a savings over gasoline.
Posted by Mark Henwood on March 9, 2012 at 8:46 am under Market commentary.
Comments Off on Oil / gas price disparity at a new record..
Since 2005 California’s Public Utilities Commission has been publishing a Market Price Referent (MPR) based on a 500 MW combined cycle plant. The MPR serves as a benchmark for renewable projects and has been used since 2007 as the basis of contracts offered pursuant to the Feed In Tarriff (FIT) program. Predictably, since the MPR is based on a gas plant the price moves up with the outlook for gas and also moves down with the outlook for gas. The chart below illustrates this relationship:
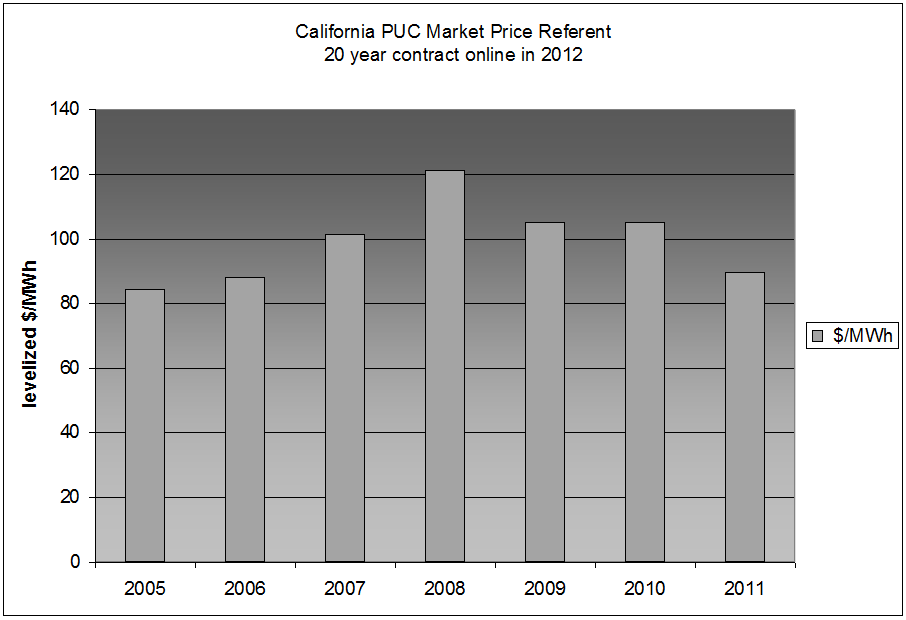
Note that the CPUC didn’t update the MPR in 2010 as gas prices were falling creating the “plateau” in 2009/2010. If the MPR were updated now I would expect another drop for the simple reason the gas prices used in 2011 are unrealistic. The 2011 NYMEX monthly contracts averaged to yield a 2012 price of $4.84/mmBtu. As of today, the Mar – Dec 2012 contracts averaged $3.05 and the monthly contract didn’t exceed $4.84 until Dec 2016.
So why does this matter if California has mandated 33% RPS and FERC has allowed avoided cost to be set based on tranches of RPS requirements?
Posted by Mark Henwood on February 21, 2012 at 9:40 pm under Market commentary.
Comments Off on Declining price for renewables challenges California.
Further highlighting the high risk nature of investing in OTC BB companies, four firm’s listings have migrated to the Pink Sheets. CCGY, SESI, GMTI, and GGRN are now on the first (or last) rung of public listing in the United States.
Posted by Mark Henwood on February 14, 2012 at 11:39 pm under News.
Comments Off on More companies move to the Pink Sheets.